Analyzing Grocery Data Using Data Mining Techniques
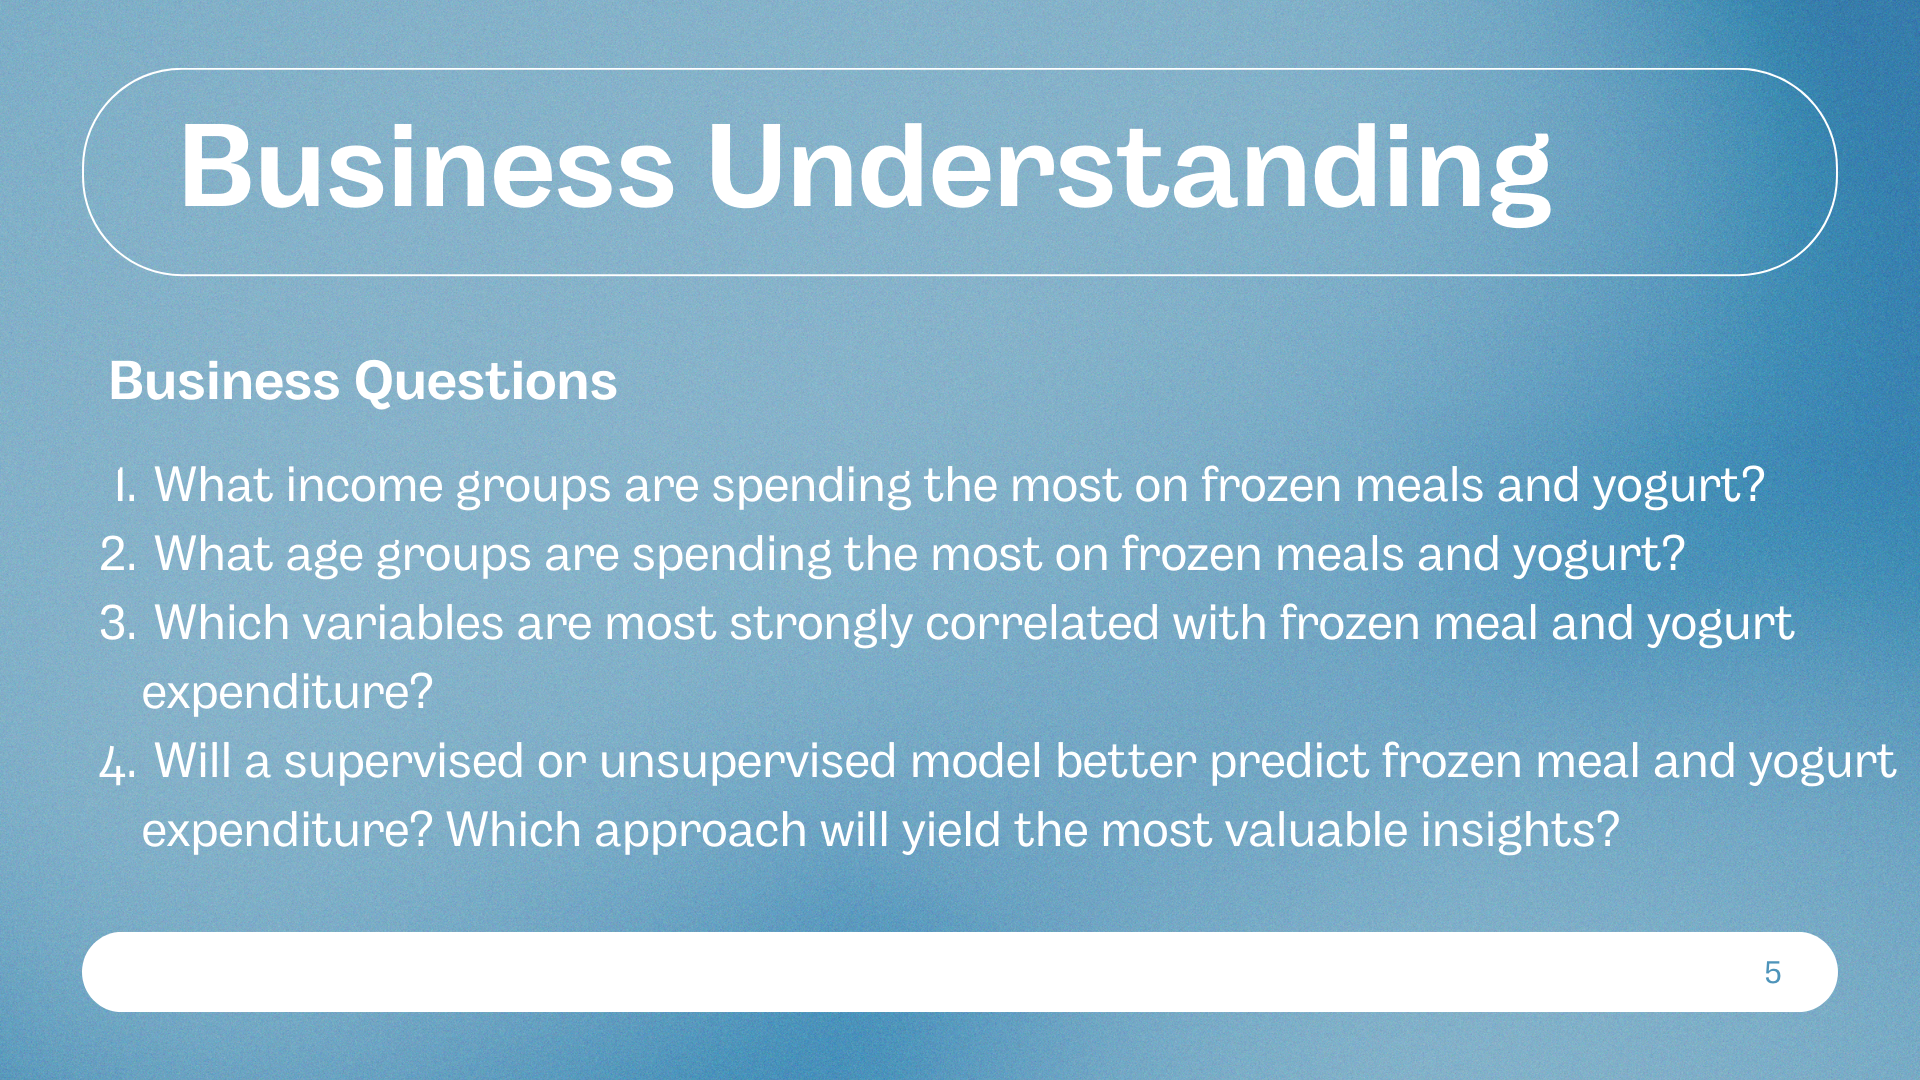
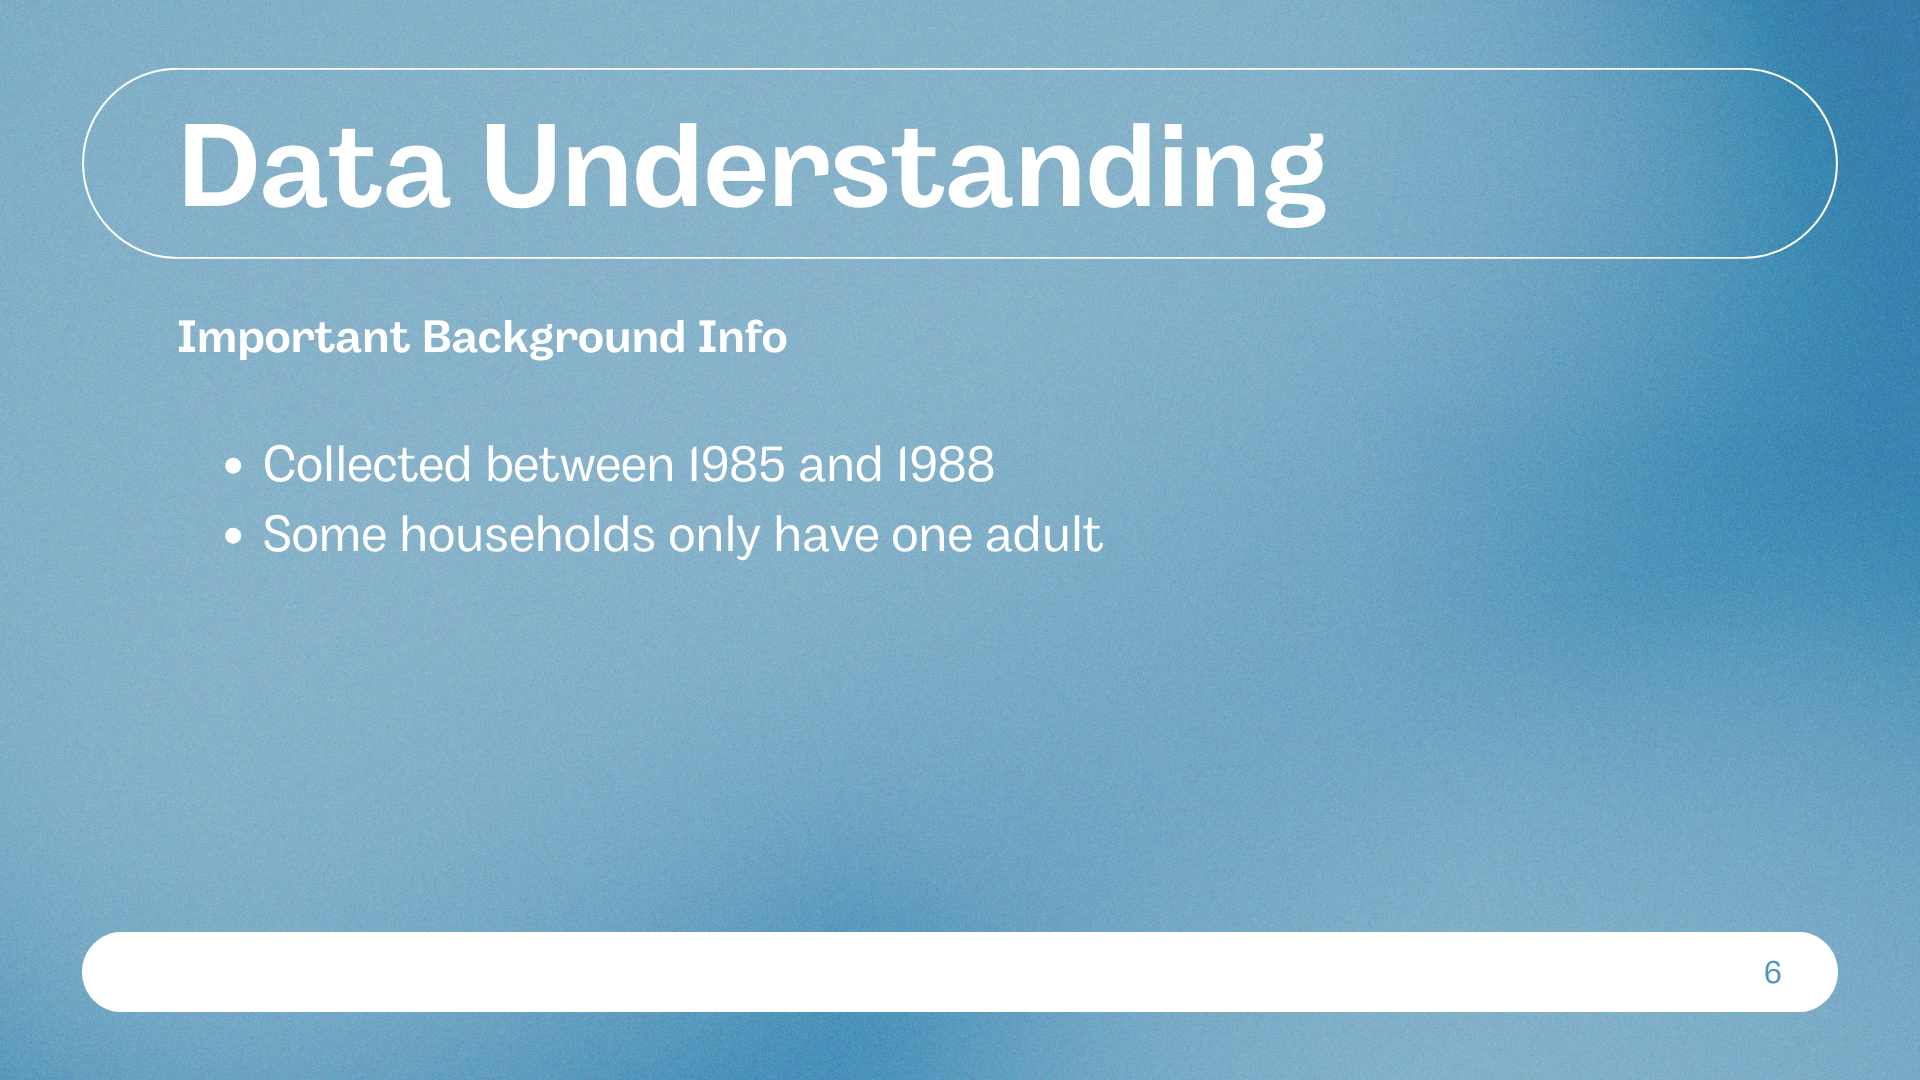
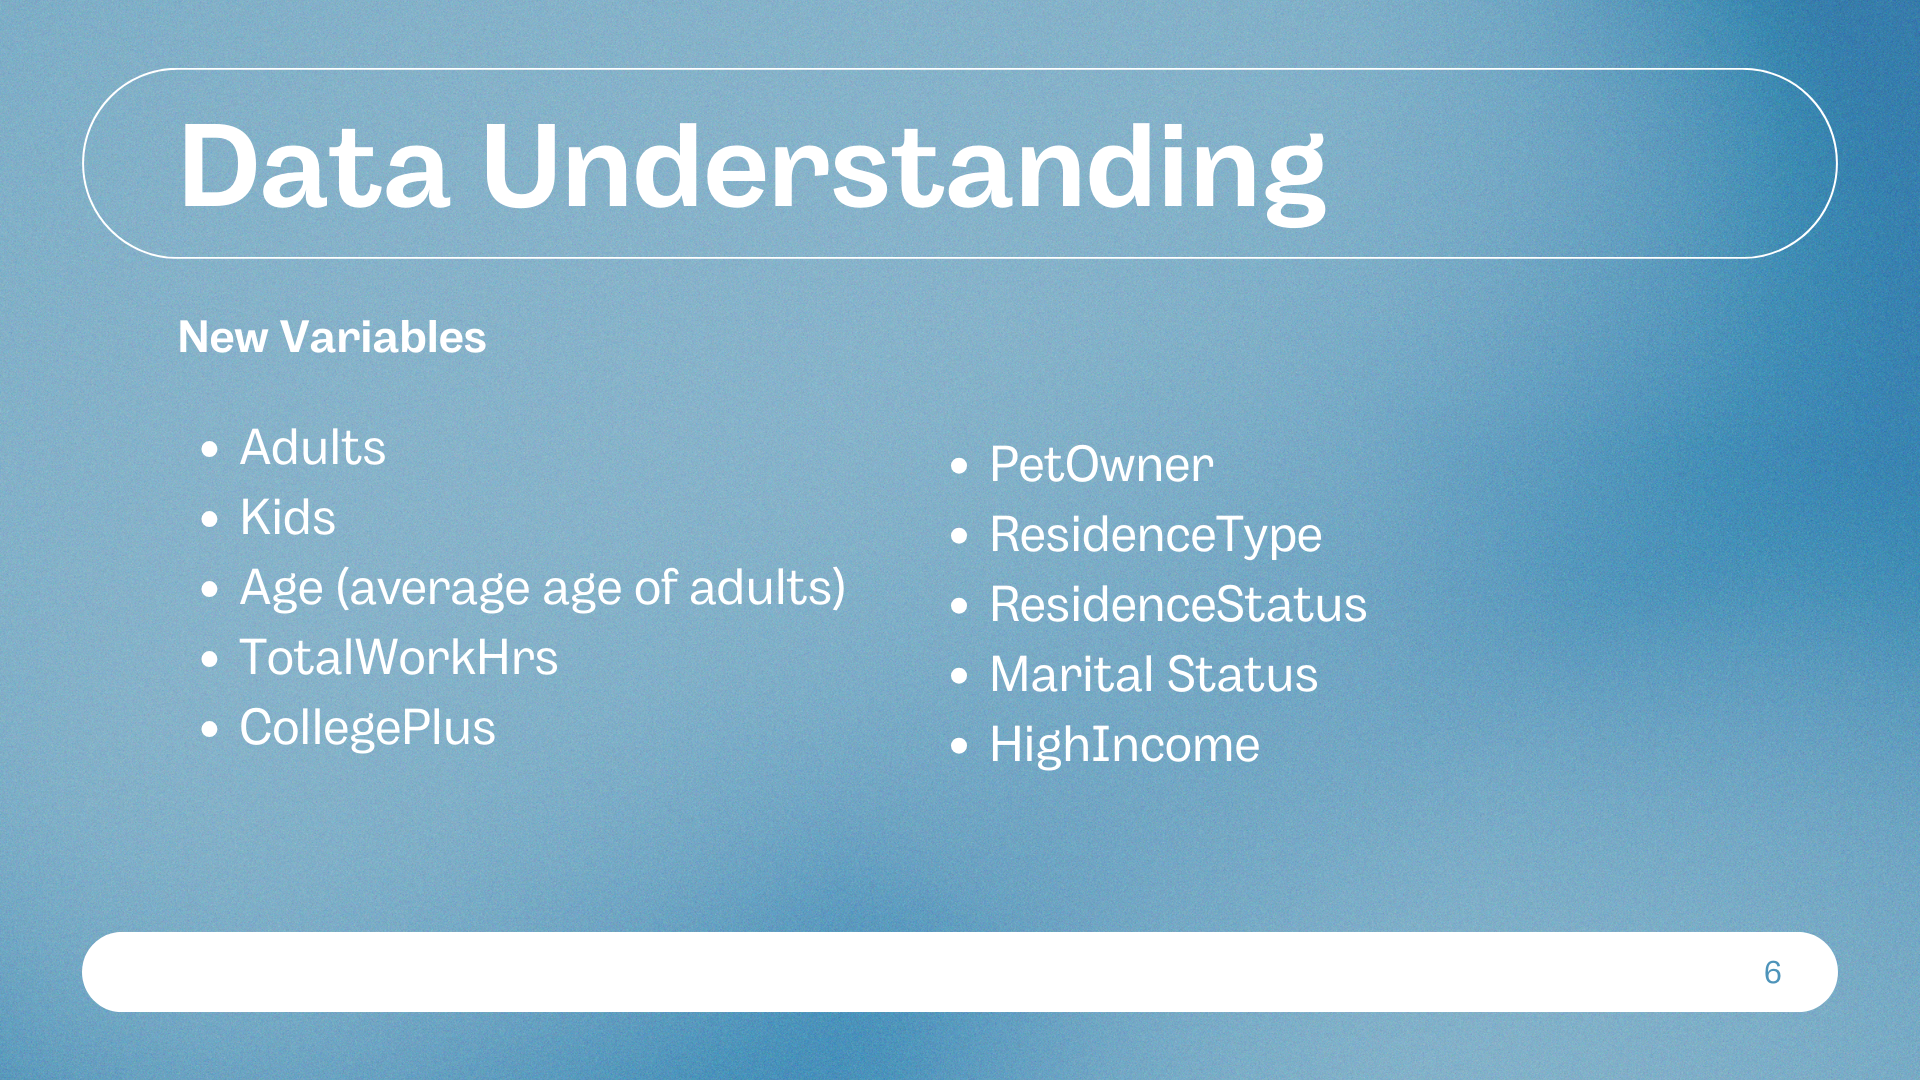
For our final project in Data Mining, my group was asked to analyze a real consumer dataset from a grocery chain to uncover what drives customer spending on yogurt and frozen dinners. The dataset included demographic info like household income, age, family size, and education level, plus how much each household spent on certain food categories. We approached the project like a business consultant team would—trying to answer key questions around customer segmentation, targeted marketing, and product strategy.
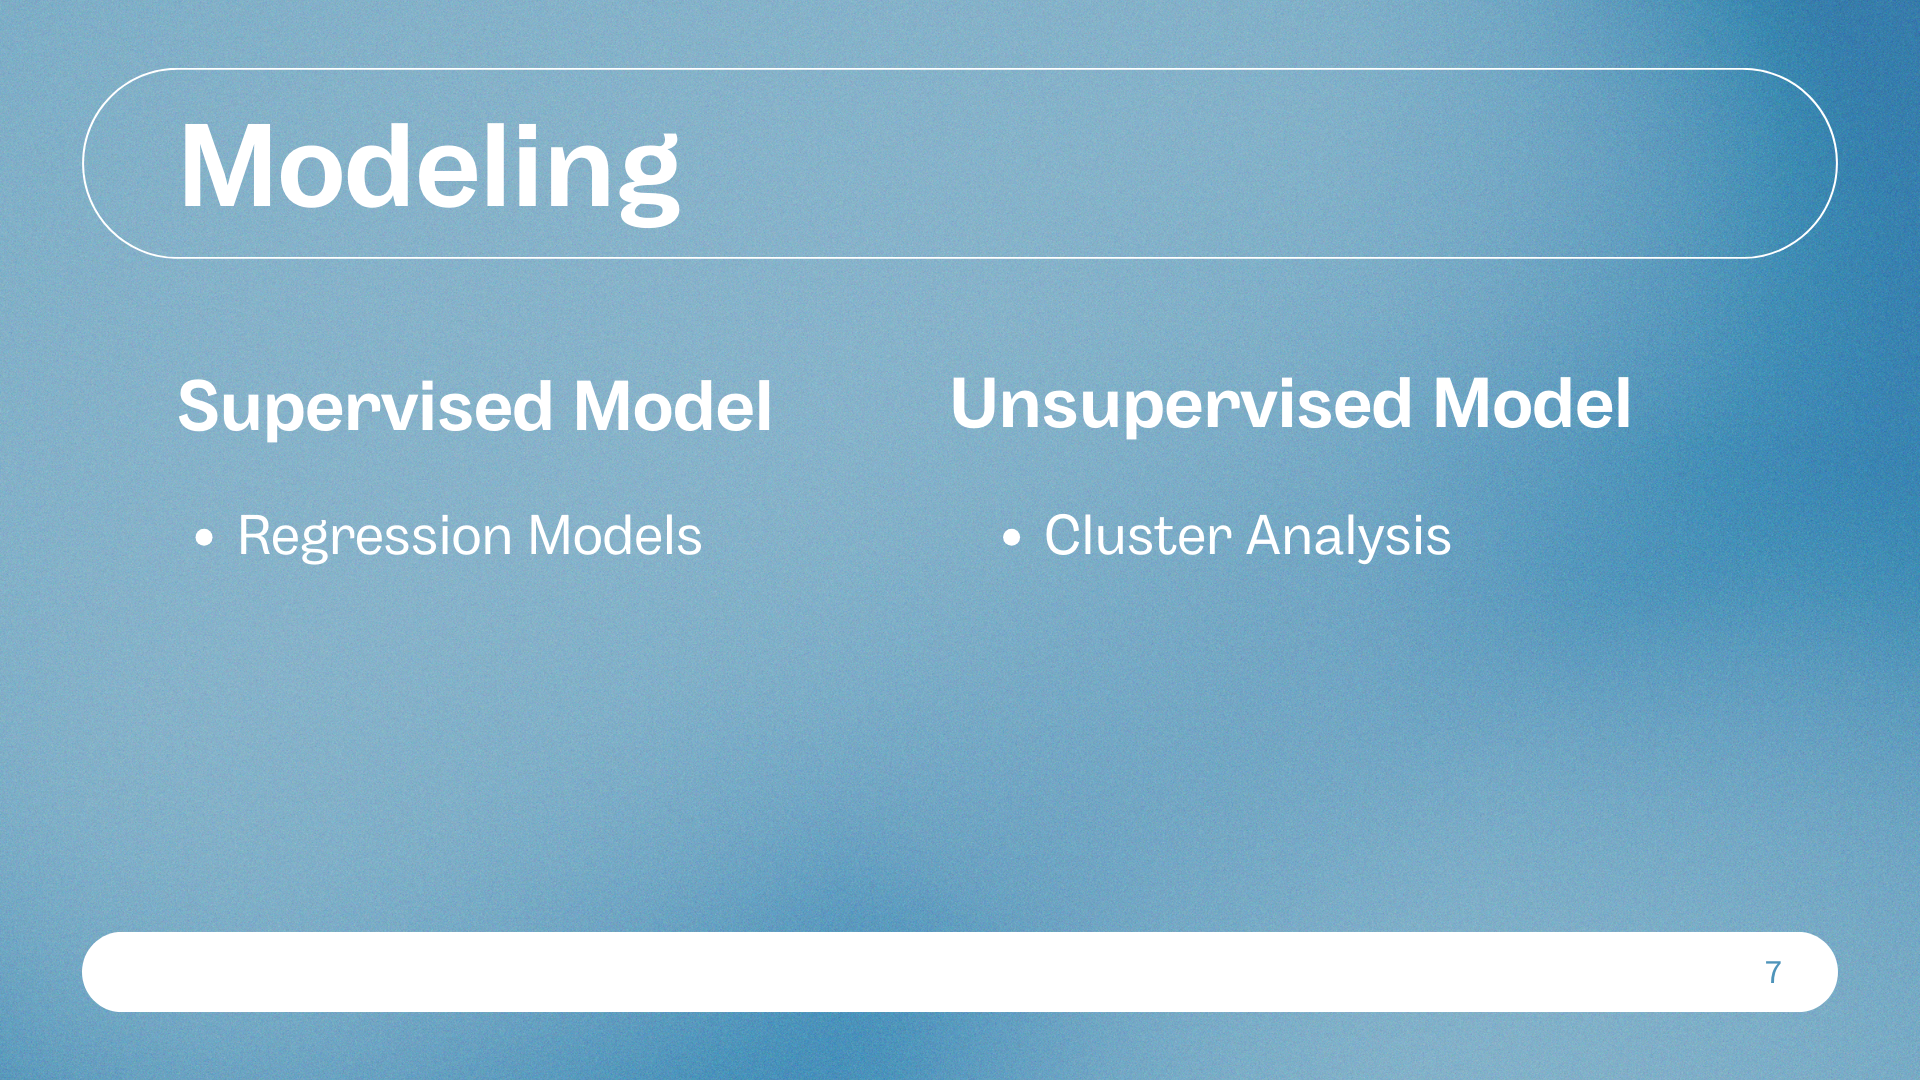
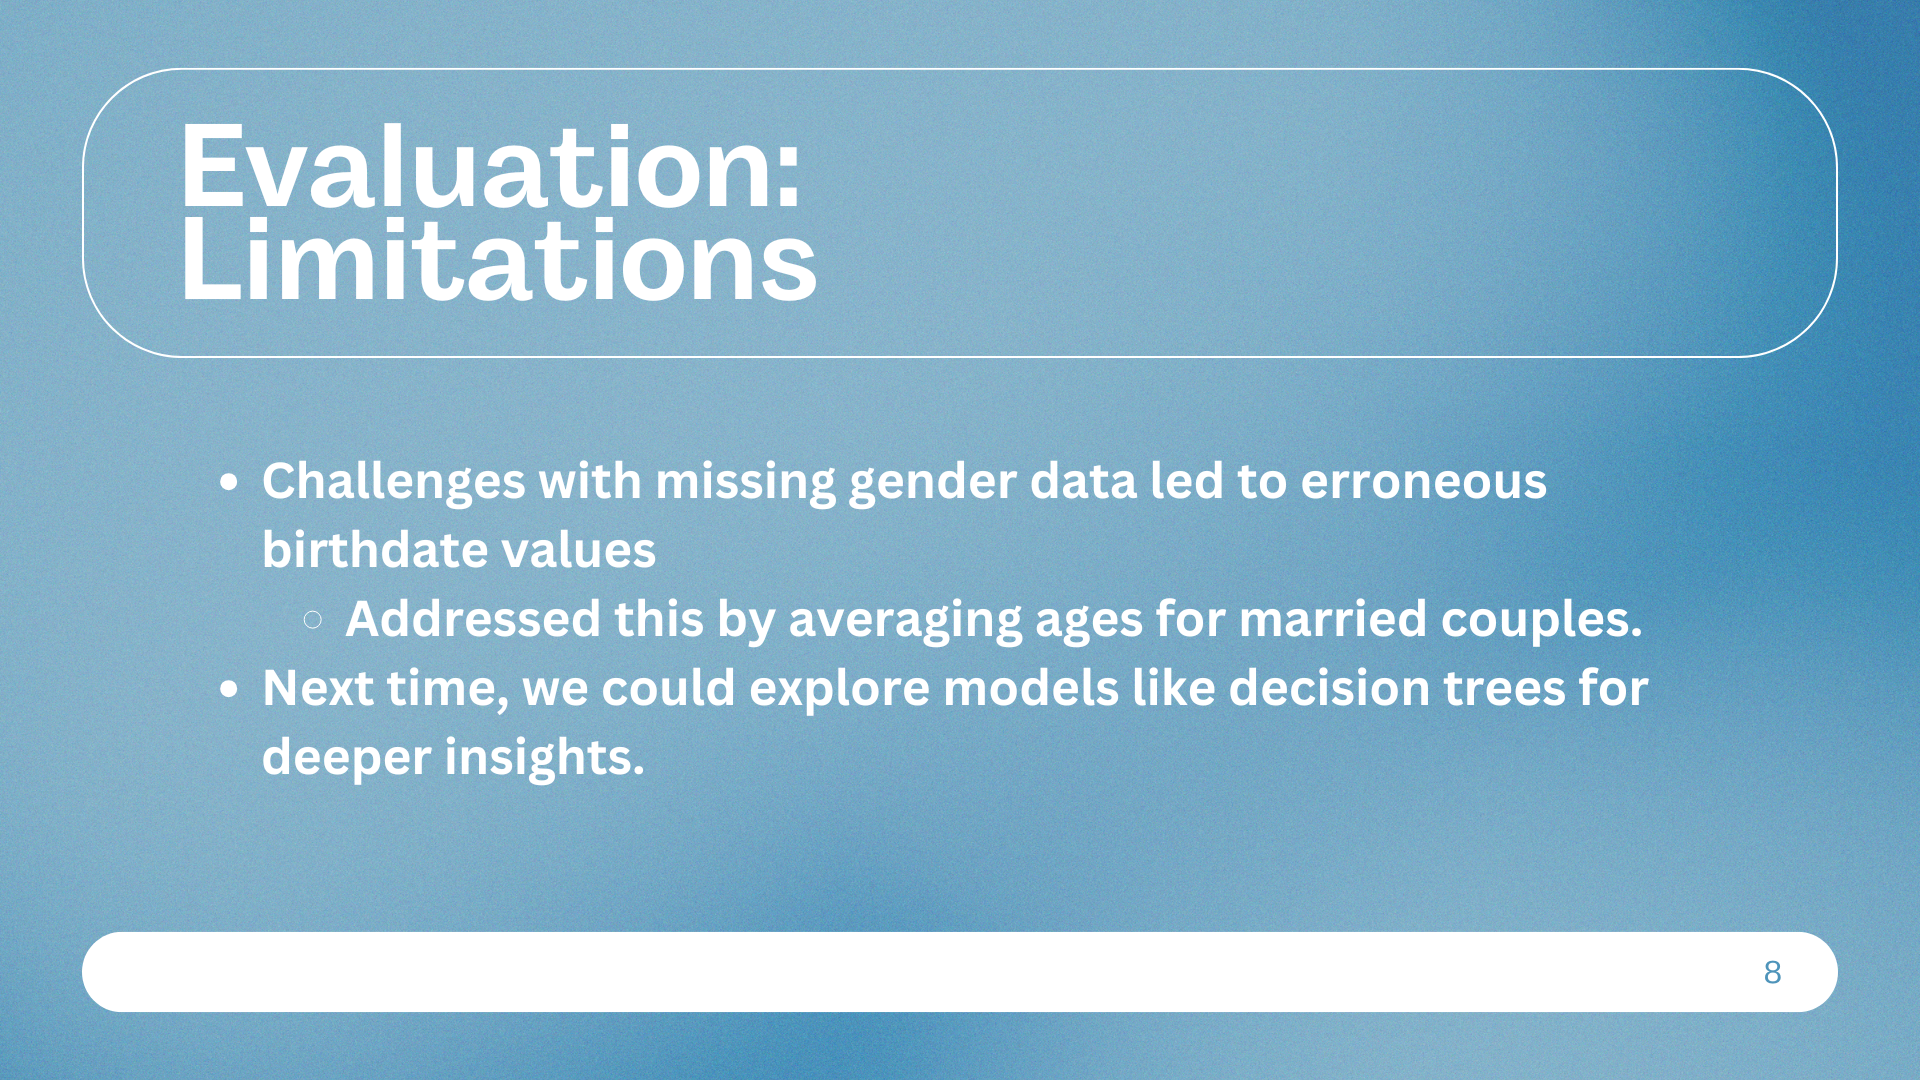
We applied the core data mining techniques we learned in class—starting with regression models to see which household traits were most predictive of higher spending, and then using k-means clustering to group consumers into meaningful segments (the R code for the cluster analysis can be found here). Our regression models gave us a clear look at variables like income, education, and number of adults as major factors. But the real insight came from clustering, which split our dataset into two very distinct consumer types—one made up of older, lower-income households with modest spending habits, and the other of younger, higher-income families who relied more on convenience foods like frozen meals.
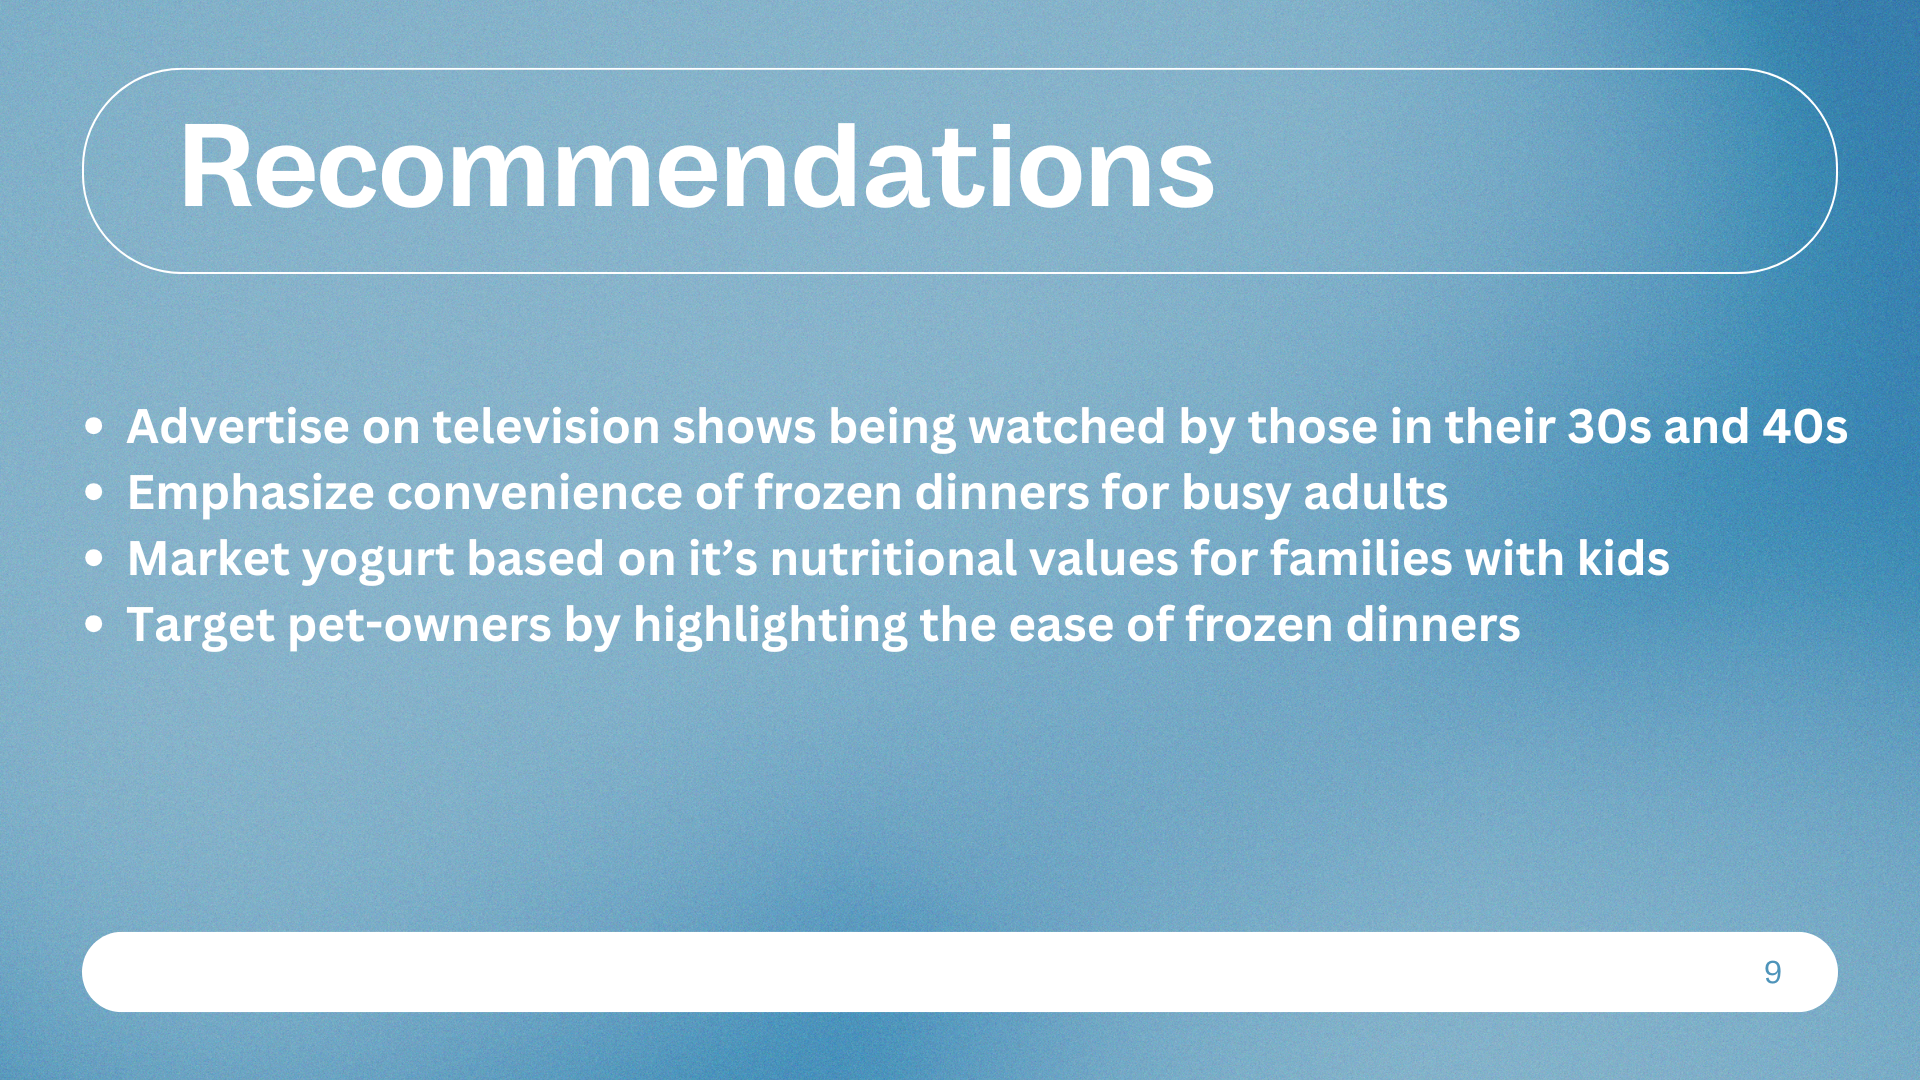
Using these insights, we came up with marketing recommendations tailored to each group. The whole process was a great example of how data can directly inform business strategy—from ad targeting to inventory planning. Below are the slides from our final presentation, where we walk through our methods, findings, and strategic takeaways.